


Insuregroup Truck Breakdown Statistics
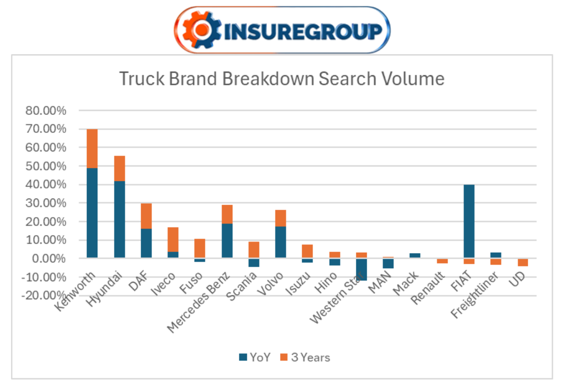
A study conducted by truck insurance broker, Insuregroup, analyses Australian search interest in truck servicing and repair by brand, using Google Keyword Planner search volume data. The dataset captures user activity across a wide range of relevant queries (e.g. “truck repair”, “mechanic near me”, “service cost”) associated with 20 of the most popular truck brands in Australia.
It measures the year-on-year (YoY) and three-year percentage changes in search volume for each brand, offering insight into whether consumer demand for maintenance or repair information is growing or declining.
The results highlight notable trends: Kenworth and Hyundai experienced the largest YoY increases in repair-related search interest, while brands like Scania and Western Star showed significant declines. This data provides a useful indicator of perceived reliability, brand age in the market, or growing service needs by make.
Results
| Brand | YoY | 3 Years |
| Kenworth | 48.89% | 21.03% |
| Hyundai | 41.67% | 13.89% |
| DAF | 16.09% | 13.68% |
| Iveco | 3.82% | 12.94% |
| Fuso | -2.02% | 10.71% |
| Mercedes Benz | 18.75% | 10.27% |
| Scania | -4.43% | 9.15% |
| Volvo | 17.36% | 8.85% |
| Isuzu | -2.23% | 7.40% |
| Hino | -3.89% | 3.74% |
| Western Star | -12.00% | 3.08% |
| MAN | -5.30% | 0.91% |
| Mack | 3.03% | -0.21% |
| Renault | 0.00% | -2.78% |
| FIAT | 40.00% | -2.87% |
| Freightliner | 3.16% | -3.27% |
| UD | 0.00% | -4.17% |
| Dennis Eagle | n/a | n/a |
| Foton Mobility | n/a | n/a |
| Volkswagen | n/a | n/a |
*Disclaimer*
We’ve compiled publicly available search data to provide an objective overview of how search interest in truck servicing and repairs has changed over time across a range of popular truck brands in Australia. This analysis is based on publicly available Google Keyword Planner search volume trends and is intended purely for informational purposes. Increased or decreased search activity may reflect a range of factors, including changes in brand popularity, fleet age, servicing behaviour, or market share, and should not be interpreted as a direct measure of vehicle reliability or performance. We encourage operators and business owners to consider multiple data points when making decisions about truck purchases, servicing strategies, or insurance coverage.
Details
Keywords Assessed
break down
breakdown
capped price servicing
fixed price servicing
maintenance
mechanic
mechanic near me
repair
roadside assist number
roadside assistance
roadside assistance phone
service
service centre
service centre near me
service cost
service near me
service pricing
truck repair
truck repair near me
truck service
truck service centre
truck service near me
Brands Assessed
DAF
Dennis Eagle
FIAT
Foton Mobility
Freightliner
Fuso
Hino
Hyundai
Isuzu
Iveco
Kenworth
Mack
MAN
Mercedes Benz
Renault
Scania
UD
Volkswagen
Volvo
Western Star
Truck Breakdown Statistics in Australia
Truck breakdown frequency statistics
-24.5% of reported vehicle breakdown incidents in New South Wales (Jan 2012–Jun 2016) involved heavy vehicles. (Science Direct)
-About 1 in 400 trucks in 2017 versus 1 in 500 in 2019 experienced a “large-loss” breakdown. (NTI)
-8.3% of all kilometres travelled on Australian roads are by heavy vehicles, which are disproportionately involved in nearly a quarter of breakdowns . (Science Direct)
-Heavy vehicles account for roughly 1-in-4 breakdowns in NSW, despite only accounting for ~3–9% of road presence. (MDPI)
-Breakdown frequency increases in summer and decreases in winter, particularly in New South Wales. (MDPI)
Truck breakdown cause, risk and defect statistics
-46% of trucks surveyed had tyre and wheel defects, making this the most common mechanical issue detected during inspections. (NHVR)
-14% of inspected trucks had brake system faults, ranking among the top defects contributing to breakdown risks. (NHVR)
-10% of trucks were found to have lighting and reflector faults during national compliance inspections. (NHVR)
-8% of heavy vehicles had structural and body defects, contributing to increased risk of mechanical failure on the road. (NHVR)
-55% of non-impact fires in truck cabins and engine bays were caused by engine and cabin electrical failures. (NTI)
-47% of non-impact fire-related breakdowns were linked to wheel-end fires, often resulting from brake or tyre failure. (NTI)
-40% of engine breakdowns during high-temperature conditions were estimated to be caused by cooling system failures. (Hi-Tec Oils)
Truck breakdown maintenance and servicing statistics
-14% higher repair costs are associated with major engine or transmission failures compared to other breakdown types. (NTI)
-30% reduction in truck breakdowns reported with regular preventive maintenance programs. (SEQ Heavy)
-20% fewer maintenance-related downtime days in fleets that implemented preventive maintenance agreements. (Simply Fleet)
-Fleets achieve up to 70% reduction in breakdowns, 30% lower maintenance costs, and 20% vehicle lifespan extension through advanced preventive maintenance and telematics. (HVI)
-50% reduction in breakdown-related labour costs achieved through scheduled servicing, compared to reactive repairs. (ATA)
-95% uptime is common among high-performing fleets with robust preventive maintenance programs. (NTTR)
Truck breakdown insurance claim statistics
-29% higher claim frequency and 22% higher claim costs are linked to coupling defects in trucks. (NTI)
-32% more claims and 26% higher costs result from tyre and wheel defects. (NTI)
-3% increase in claim frequency and 4% higher claim costs are associated with brake defects. (NTI)
-2% more claims result from minor mechanical defects, while major mechanical issues drive a 7% increase in claim frequency and 14% increase in costs. (NTI)
-9.6% of large-loss insurance claims involved driver fatigue, while 39% were caused by inattention or distraction. (NTI)
-25% of large-loss fatigue claims involved multi-combination vehicles, and 32% involved B-doubles. (NTI)
-1 in 500 trucks experienced a large-loss breakdown (claims over $50,000) in 2019, compared to 1 in 400 in 2017. (NTI)
Truck breakdown cost impact statistics
-Upwards of $5,000 AUD per incident is commonly reported for unscheduled truck breakdowns, factoring in emergency repairs, driver wages, towing fees and penalties for delayed deliveries. (Fleet HV)
-Heavy trucks typically incur between $650–1,100 AUD per day in downtime costs, including lost revenue, driver wages and admin overhead. (Fleet HV)
-Unplanned repair labour (from breakages) can be up to 2x more costly than planned servicing due to urgent diagnostics, premium parts and emergency logistics. (Stratio)
-Towing costs range from AUD 800 to 3,000, depending on location/access. (NSW Fair Trading)
Truck breakdown location and configuration statistics
Percentages based on non-conformity with roadworthiness based on a 2024 survey, indicating vehicle types and locations where breakdowns are more likely to occur. (Fleet HV)
-33% of trucks inspected in metropolitan areas were non-conforming.
-32% of trucks inspected in regional areas were non-conforming.
-9% of rigid trucks were non-conforming.
-32% of semi-trailers were found non-conforming.
-23% of B-doubles and road trains were reported as non-conforming.
-20% of plant and special purpose vehicles (SPVs) were non-conforming.
Estimated Truck Insurance Costs by Vehicle Type
-$9,000–15,000/year is the average insurance premium for semi-trailers and prime movers, with costs rising up to $30,000/year depending on risk profile and usage.
-$2,000–4,000/year is the estimated cost for leased trucks operated by owner-drivers or fleets under structured service and finance agreements.
-70% of mid-to-large fleet operators in Australia take out comprehensive truck insurance, adding to total premium costs but offering broader liability, breakdown and cargo cover.
-Higher premiums are typically paid for B-doubles, road trains, and long-haul vehicles, due to increased replacement costs, complex freight exposure and greater liability risks.